Wednesday 19 July 8:30 a.m. - 9:40 a.m. (Canada/Eastern)
Abstract
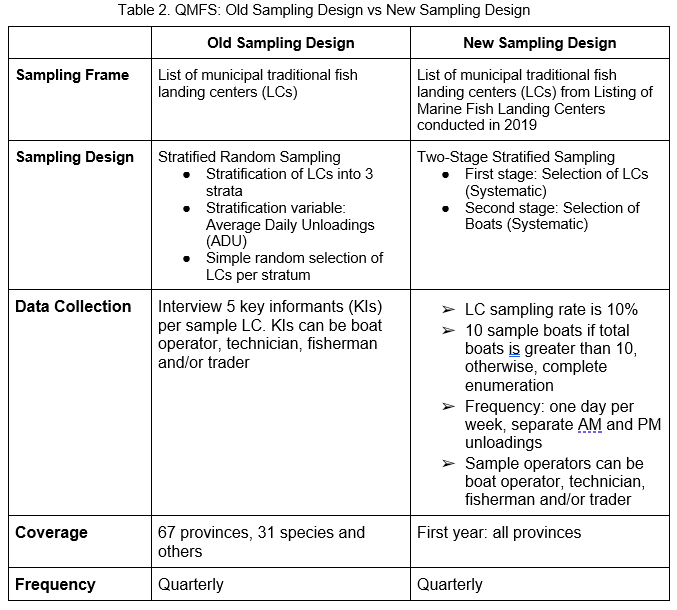
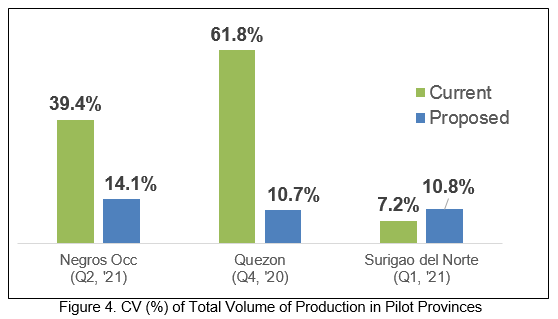
The Quarterly Municipal Fisheries Survey (QMFS) is a nationwide survey conducted by the Philippine Statistics Authority that generates quarterly volume and value of production by species unloaded at municipal fish landing facilities. The old design of QMFS uses stratified random sampling of traditional municipal landing centers. In the old design, there is a non-probabilistic selection of key informants (KIs) per sample landing center (LC) which indicates that not all fishing operators have the chance to be selected. Also, data collected is not based on the actual catch of the day, instead it relies on recall of the KIs for a monthly catch in each quarter for the whole LC which may indicate a bias on the recall. Moreover, the number of fishing days in a month and the total number of fishing boats in each day is not estimated in the survey. Given these limitations, there is a need to revisit the sampling design of QMFS. After performing sampling experiments and simulations, the new sampling design for QMFS is a two-stage stratified sampling with systematic selection of landing centers in the first stage and systematic selection of boats in the second stage. The sampling rate of landing centers is 10%. If the total boats in a landing center is greater than 10, 10 boats are sampled, otherwise, all boats are sampled. The frequency of data collection is once a day per week where AM unloading is separated from PM unloading. The new sampling design provides estimates that passed the acceptable reliability measures at the provincial level.
Figures/Tables
Table 2 QMFS Old Sampling Design vs New Sampling Design
Figure 4 CV of Total Volume of Production in Pilot Provinces