Measuring the carbon footprints of portfolios Emission intensities and financed emissions indicators from Multi-Regional IO and Air Emission Accounts
Conference
65th ISI World Statistics Congress
Format: IPS paper - WSC 2025
Session: IPS 960 - Carbon Statistics, Carbon Disclosure and Carbon Accounting
Tuesday 7 October 10:50 a.m. - 12:30 p.m. (Europe/Amsterdam)
Abstract
Carney (2016) identifies transition risk as by far the most important channel through which climate change can affect financial stability. It ‘could result from the adjustment towards a lower-carbon economy. Changes in policy, technology and physical risks could prompt a reassessment of the value of a large range of assets as costs and opportunities become apparent.’ Scientists and analysts attribute the exposure to transition risks principally to activities leading to Greenhouse Gas (GHG) emissions, both on the aggregate level as well as for individual agents. In this context, indirect emissions clearly are as important as direct emissions, if transition risk are to be understood as a systemic risk. Total carbon content of output, defined as the sum of direct and upstream indirect emissions, is the most comprehensive measure for transitional risk, as it captures all emissions due to the production of this output and yields a direct metric for the sensitivity of emission of carbon taxes.
This paper has a focus on financial portfolios and is meant to be a hands-on guide. It describes how industry level data on production interlinkages and on direct emissions can be used to generate estimates for indirect emission intensities for aggregate portfolios. Essentially, this is done by attributing industry level intensities to entities and computing weighted averages of these intensities.
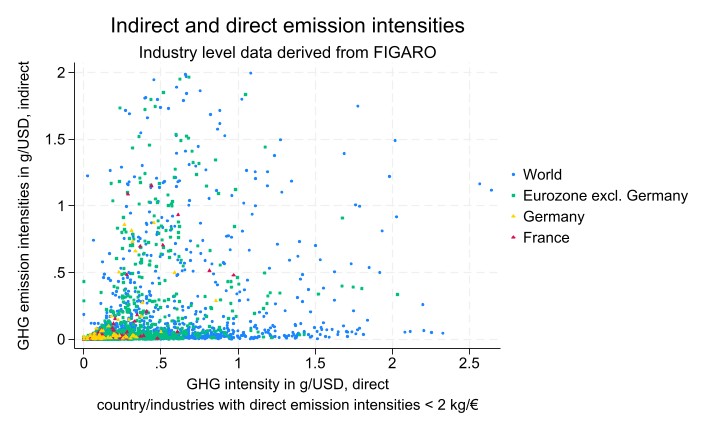
The first part of this essay explains the nature of indirect emissions and how they are constituted by production interlinkages in the context of a linear production model. The second part describes how to approximate these expressions based on aggregate data. A third part looks at results for industries, groups of counties, groups of products, with a closer look on Germany, and the components of carbon content for the output or Euro area countries are computed as a time series.
A final part presents an important application: computing the weighted average carbon intensity of banks in Germany. Emission intensities are matched with outstanding bank loans according to industry compounds, as provided by the German balance sheet statistics. It turns out that bank lending in Germany, according to data from the Corporate Financial Statement Statistics, is characterised by a strong and persistent bias towards high emission industries. This bias is entirely due to a disproportionate reliance of the energy, water supply and disposal industries on bank financing. The analysis is corroborated and refined by means of data from the Balance Sheet Items (BSI) Statistics, uncovering an additional marked overweighting in the loans portfolio with relevance for sustainability.
Figures/Tables
Dispersion_tot_em