Wednesday 8 October 9:20 a.m. - 10:30 a.m. (Europe/Amsterdam)
Abstract
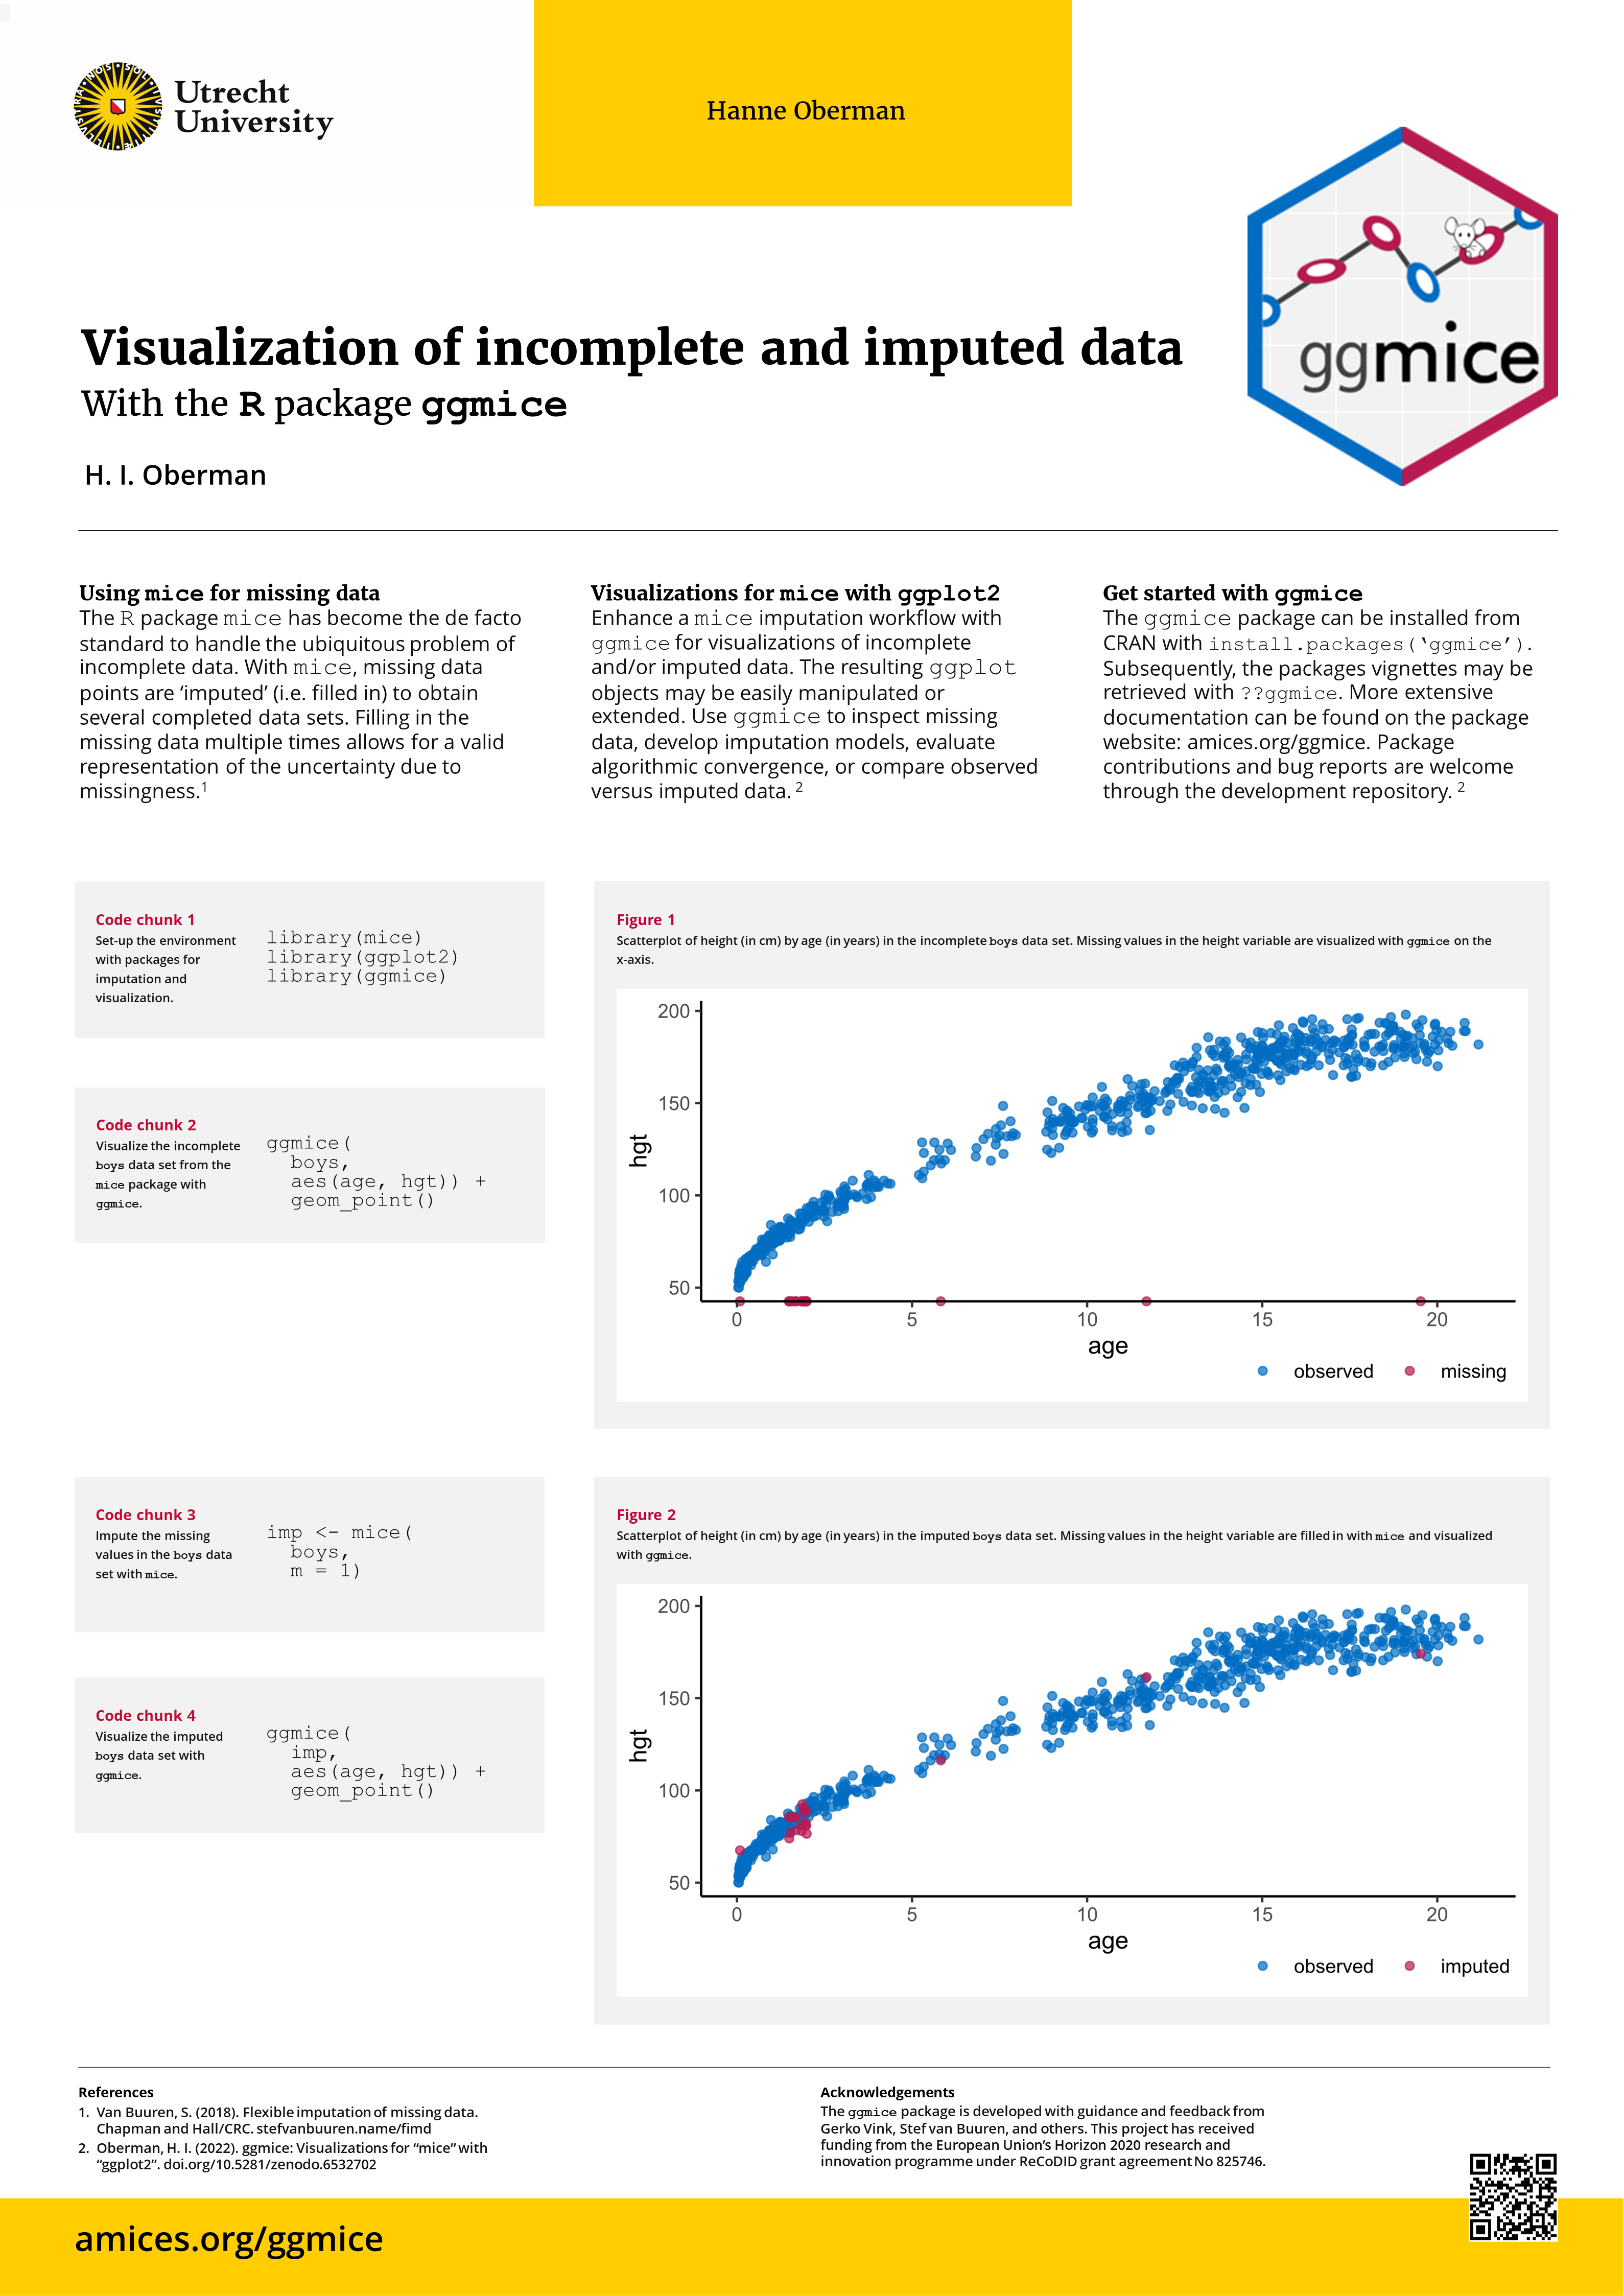
In many data analysis efforts, missing data are conveniently ignored. With default settings such as ‘list-wise deletion’ in analysis software, analysts need not even bother with the ubiquitous problem of incomplete data. I argue that this is wasteful: not only can missing data bias analysis results if not addressed well, but moreover, the missing data itself can provide valuable insights into the phenomena of interest. The visualisation of incomplete data can uncover insights into the missing data that may otherwise go overlooked. The R package {ggmice} aids data analysts in exploring the missing parts of their data, using the grammar of graphics and imputation (R packages {ggplot2} and {mice}). In this presentation, I will showcase the use and usefulness of a data visualisation workflow for incomplete datasets in R.