A multidimensional household level Climate Risk Index
Conference
10th International Conference on Agricultural Statistics
Format: CPS Paper - ICAS 2026
Keywords: index
Abstract
Climate change is increasingly reshaping household-level decision-making across a wide range of livelihood domains, particularly in agriculture, where shifts in temperature, precipitation, and seasonality are altering production strategies, labor allocation, and resource use patterns (Morton, 2007). Such transformations are not uniform but are highly dependent on differential access to resources, infrastructure, and adaptive capacities at the household and community level. This heterogeneity in climate impacts underscores the need for tools that can capture risk at scales that matter most for both adaptation and resilience planning. While global frameworks such as the Sendai Framework for Disaster Risk Reduction emphasize the integration of risk knowledge across scales (UNDRR, 2015), and the IPCC Fifth Assessment Report promoted a risk-based approach that conceptualizes risk as the interaction of hazard, exposure, and vulnerability (IPCC, 2014), recent advances in the IPCC Sixth Assessment Report (AR6) have deepened and clarified this foundation. AR6 defines risk as “the potential for adverse consequences for human or ecological systems arising from dynamic interactions among climate-related hazards, exposure, and vulnerability”. It further highlights that both hazards and vulnerabilities evolve across space and time, and that vulnerability is not uniform but varies significantly within communities, across regions, and even between households (IPCC, 2022). These conceptual refinements point to a pressing methodological gap: the need for scalable, granular, household level indicators that can capture differentiated adaptive capacities and evolving exposure patterns, while integrating spatial hazard severity with household-specific characteristics (Birkmann et al., 2013; Cardona et al., 2012).
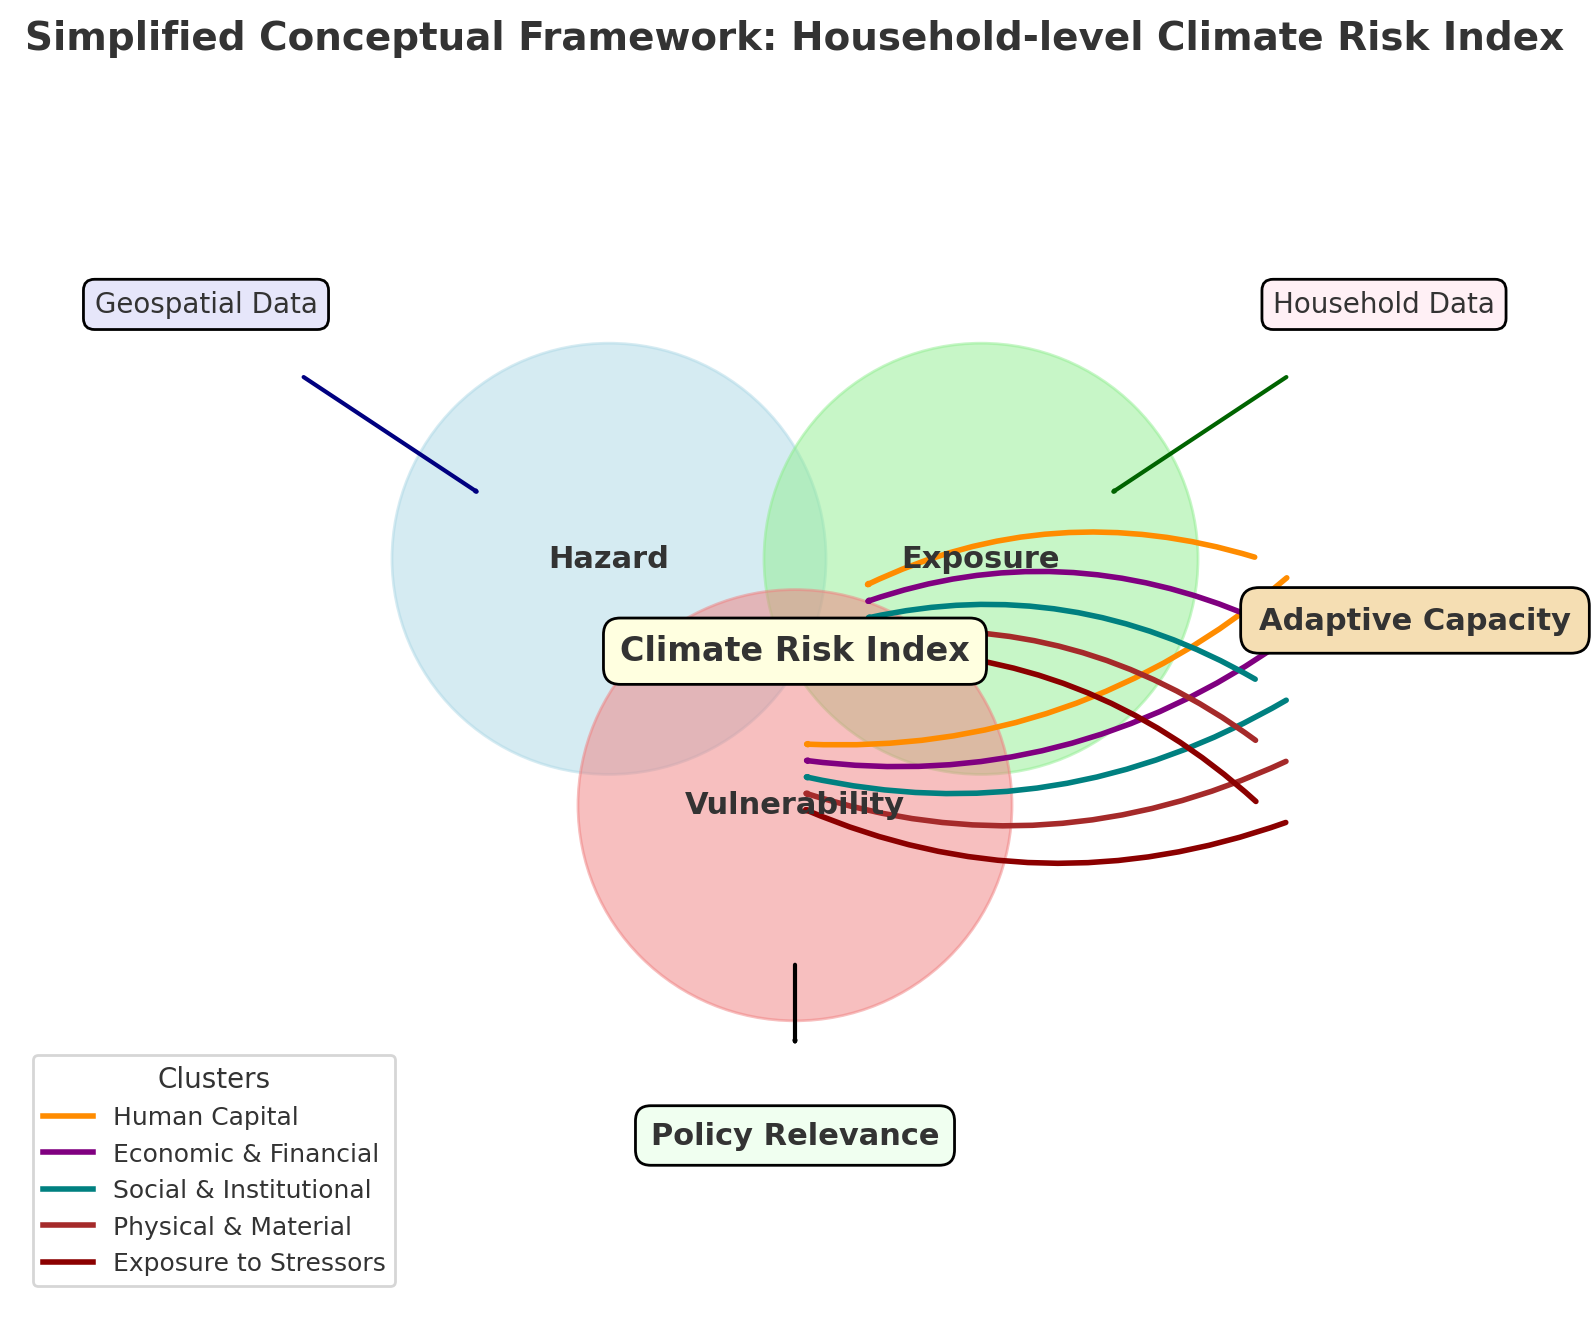
To address this gap, this paper proposes a novel multidimensional household-level Climate Risk Index (CRI) designed to quantify five interrelated components of disaster risk: hazard severity, hazard intensity, exposure, vulnerability, and adaptive capacity. By focusing on household-level data integrated with geospatial hazard assessments, the framework provides a higher-resolution picture of climate risk that is both spatially explicit and socially disaggregated. This methodological advance directly responds to calls for localized risk parameters capable of informing equitable and context-sensitive adaptation planning.
The hazard component of the index is derived from high-resolution geospatial datasets and remote sensing products that measure the severity and intensity of climate-related hazards, specifically floods, droughts, extreme temperatures, and wildfires. Remote sensing provides consistent, spatially explicit measures of hazard magnitude and frequency (Chakraborty et al., 2019), enabling the identification of climate hazard “hotspots” with greater accuracy than aggregated regional metrics. The geospatial hazard layers are then linked to household survey data through spatial overlays, allowing the intensity of hazard exposure to be mapped directly onto household locations and characteristics.
To operationalize exposure, vulnerability, and adaptive capacity, the household-level component of the Climate Risk Index consolidates twenty-five detailed indicators into five higher-order clusters. These clusters are: (1) Physical and Material Assets, including housing, agricultural technology, and energy access; (2) Human Capital, encompassing demographic profiles, education, health status, and gendered empowerment; (3) Economic and Financial Capacity, capturing fragility, financial buffers, and protection mechanisms; (4) Social and Institutional Capital, reflecting networks, information access, and collective action; and (5) Exposure to Climate and Environmental Stressors, covering rural dependence, hazard contact, and direct shock exposure. This clustering approach provides a granular yet structured representation of household risk, linking empirically grounded, survey-based indicators with geospatial hazard data. It reflects established frameworks of vulnerability and resilience (Cutter et al., 2003; Tschakert et al., 2010) while making the index scalable and analytically tractable for micro-level policy application.
The integration of hazard severity with household-level socioeconomic data represents the methodological innovation of the CRI. Existing indices often operate at aggregated regional or national scales, obscuring intra-community variation in exposure and resilience (Rufat et al., 2015). By combining granular geospatial hazard measures with household-specific vulnerability indicators, the CRI captures risk heterogeneity within communities and highlights differentiated adaptive capacities. This fine-grained analysis is particularly valuable in agricultural contexts, where even neighboring households may face divergent risk profiles due to variations in land quality, crop choices, access to irrigation, or housing conditions.
Beyond methodological advancement, the CRI has significant policy relevance. First, it facilitates the identification of households most at risk, enabling targeted interventions in climate adaptation and disaster risk reduction. Second, it supports resource allocation by providing evidence-based insights into where investments in infrastructure, services, or capacity-building can yield the greatest resilience gains. Third, it enhances the ability of policymakers, practitioners, and researchers to monitor risk dynamics over time, capturing how hazard intensity and household vulnerability evolve under climate change. Such insights are critical for designing adaptation strategies that are not only technically sound but also socially equitable and locally appropriate (Adger et al., 2005; Winsemius et al., 2018).
In conclusion, by synthesizing remote sensing with household survey data, the CRI represents a robust and scalable tool for advancing climate risk science while also providing policy-relevant evidence to support adaptation, resilience, and sustainable development at the household scale.
Figures/Tables
output (1)