Maize is one of the most important cereal crops worldwide due to the versatility of grain uses, ranging from human consumption to the production of ethanol, oil, and livestock feed. In Argentina, a sharp increase in maize area expansion occurred after the 2008/09 season, consolidating the country, in the last five years, as the fourth largest producer globally, after the United States, China, and Brazil (FAO, 2024). Production is geographically distributed from southern Buenos Aires to northern Salta, with a concentration in Córdoba, Buenos Aires, Santa Fe and Santiago del Estero. This wide latitudinal range and diversified sowing dates ensure maize presence throughout most of the year, favoring pathogen persistence and spread.
Corn stunt disease gained major relevance during the 2023/24 growing season. It is caused primarily by Spiroplasma kunkelii and transmitted by the corn leafhopper (Dalbulus maidis). In Argentina, maize is the only host for this insect vector, which is most abundant in northern provinces, typically north of 30° S. Typical symptoms include foliar chlorosis, shortened internodes, reddening of leaf margins, and ear proliferation. Symptom expression varies depending on infection timing, temperature, maize hybrid, and the presence of other pathogens, with both direct and indirect effects on yield.
Vegetation indices from satellite imagery allow inference of plant health and canopy density. Green leaves reflect strongly in the near-infrared (NIR, 700–1300 nm) and weakly in the visible spectrum (400–700 nm) due to chlorophyll absorption. The Simple Ratio (SR) and the Normalized Difference Vegetation Index (NDVI) are the most commonly used indices to assess vegetation cover.
The objective of this study was to evaluate the validity of remote sensing tools to assess the impact of corn stunt disease. Specifically, we analyzed the use of NDVI and SR as indicators of infection and validated their application in crop mapping and damage estimation. Santiago del Estero province was selected as the study area due to data availability and the relevance of corn leafhopper incidence.
Field information was collected through the Random Segments Method during the 2023/24 season (March–April). This methodology, applied by the Dirección de Estimaciones Agrícolas, de la Secretaría de Agricultura, Ganadería y Pesca de la Nación, involves direct field observation for the estimation of sown areas of extensive crops. From the complete survey, we selected the land-use units with maize as the main cover for the study area, resulting in 293 polygons. In the same field campaign, delegates recorded in the “Observations” column whether corn stunt symptoms were visible, which allowed us to distinguish between affected and unaffected fields.
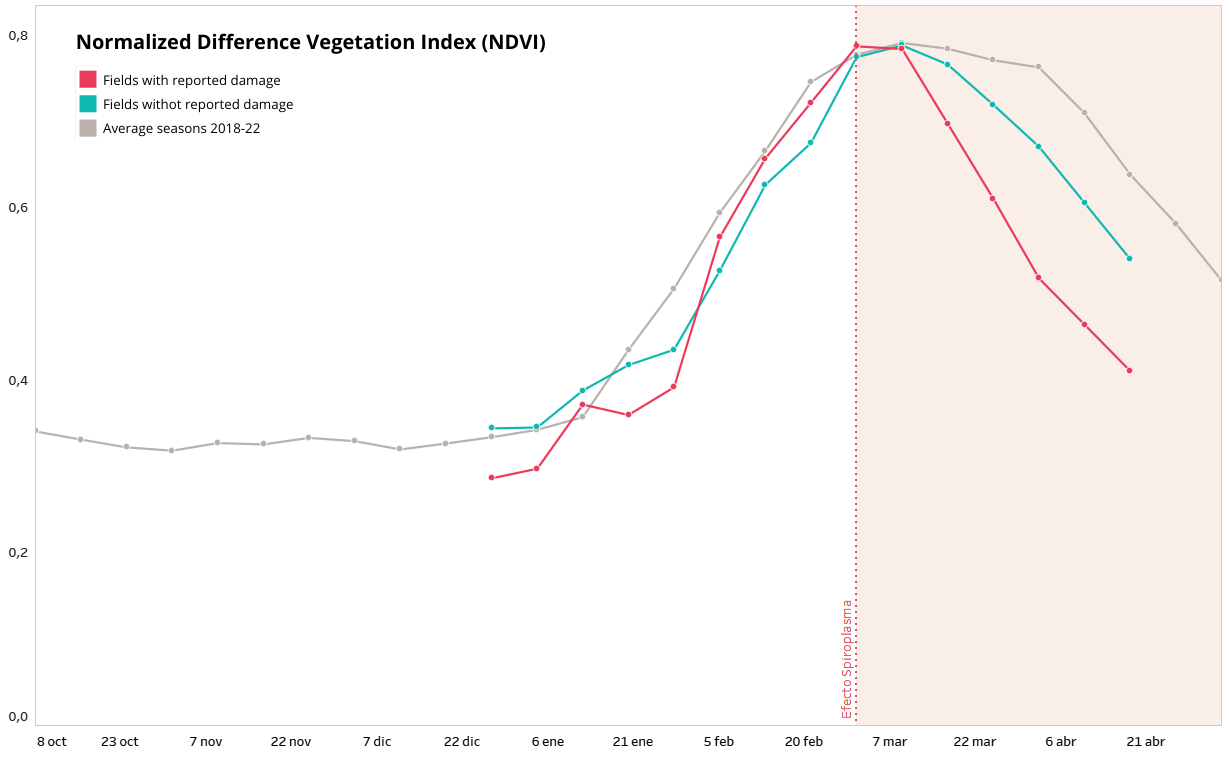
To generate vegetation index curves (SR, NDVI), we used Google Earth Engine. For each group of fields (with and without corn stunt observations), mean index values were calculated every 8 days using the VNP09H1 product from the VIIRS sensor (Suomi NPP, 500 m resolution). The analysis period spanned from December 27, 2023, to April 13, 2024, covering maize growth from early stages to maturity. Additionally, NDVI curves from five previous seasons (2018–2022) were used as a baseline for anomaly detection. An analysis of variance (ANOVA) was performed to evaluate differences between infected and non-infected plots.
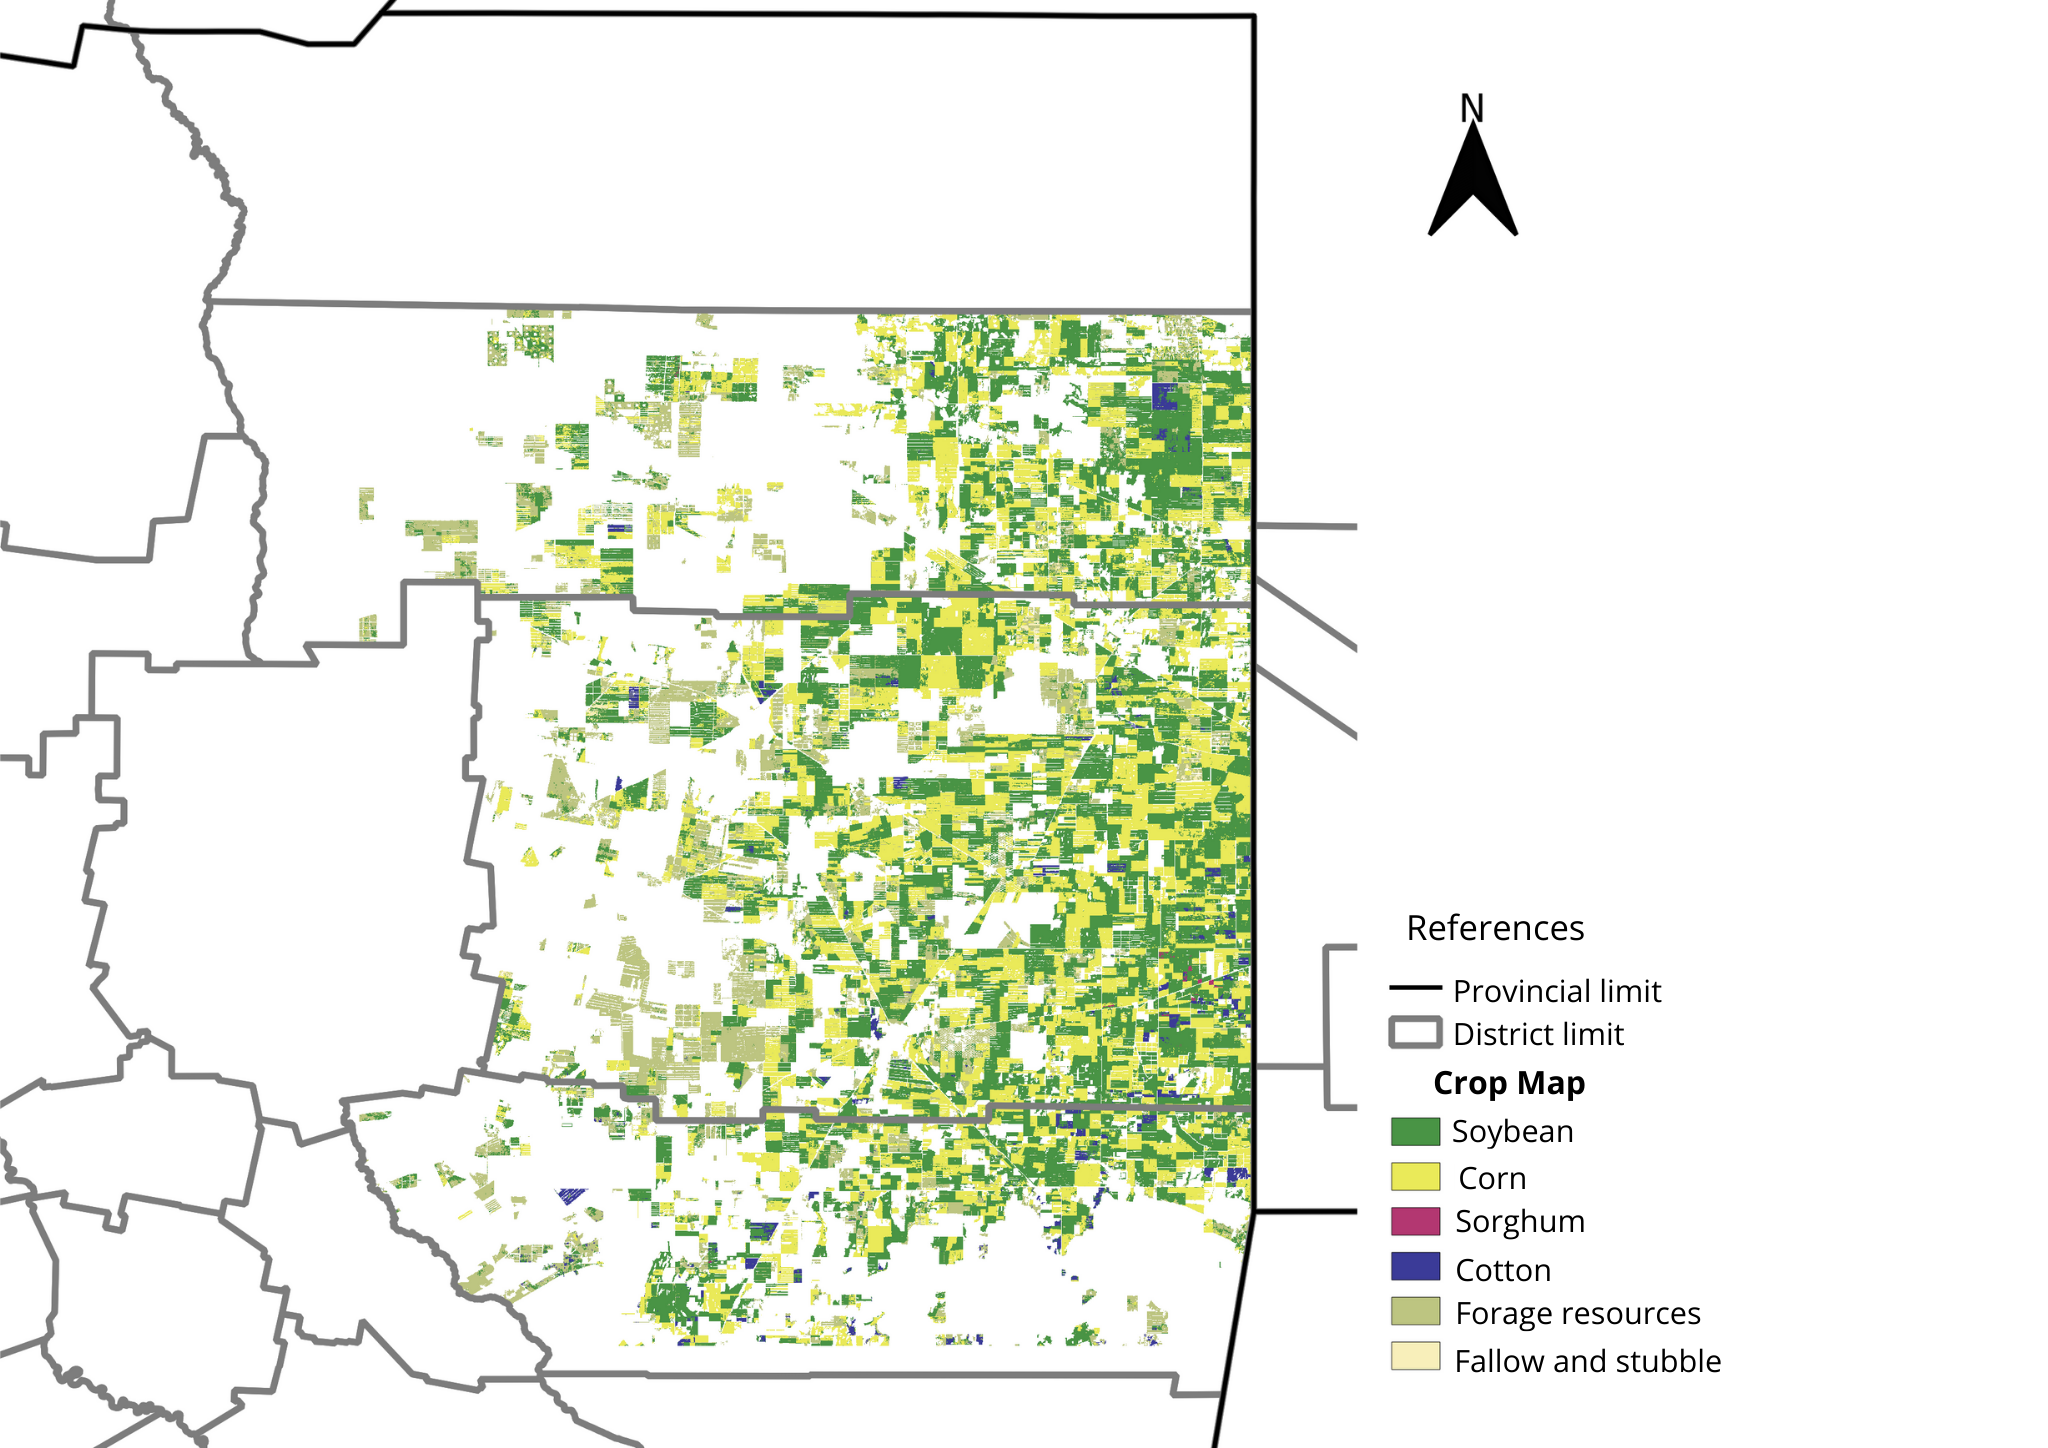
After identifying differential NDVI dynamics (Fig. 1), we extrapolated results to a wider area. A preliminary crop map was generated for the departments of Alberdi, Moreno, and J. F. Ibarra (eastern Santiago del Estero) using Sentinel-2 imagery (Fig. 2). Multiple vegetation indices were calculated and a supervised classification with the random forest algorithm was performed. Later, maize fields were vectorized, and a 200 × 200 m grid was applied to subdivide large polygons for finer-scale statistics.
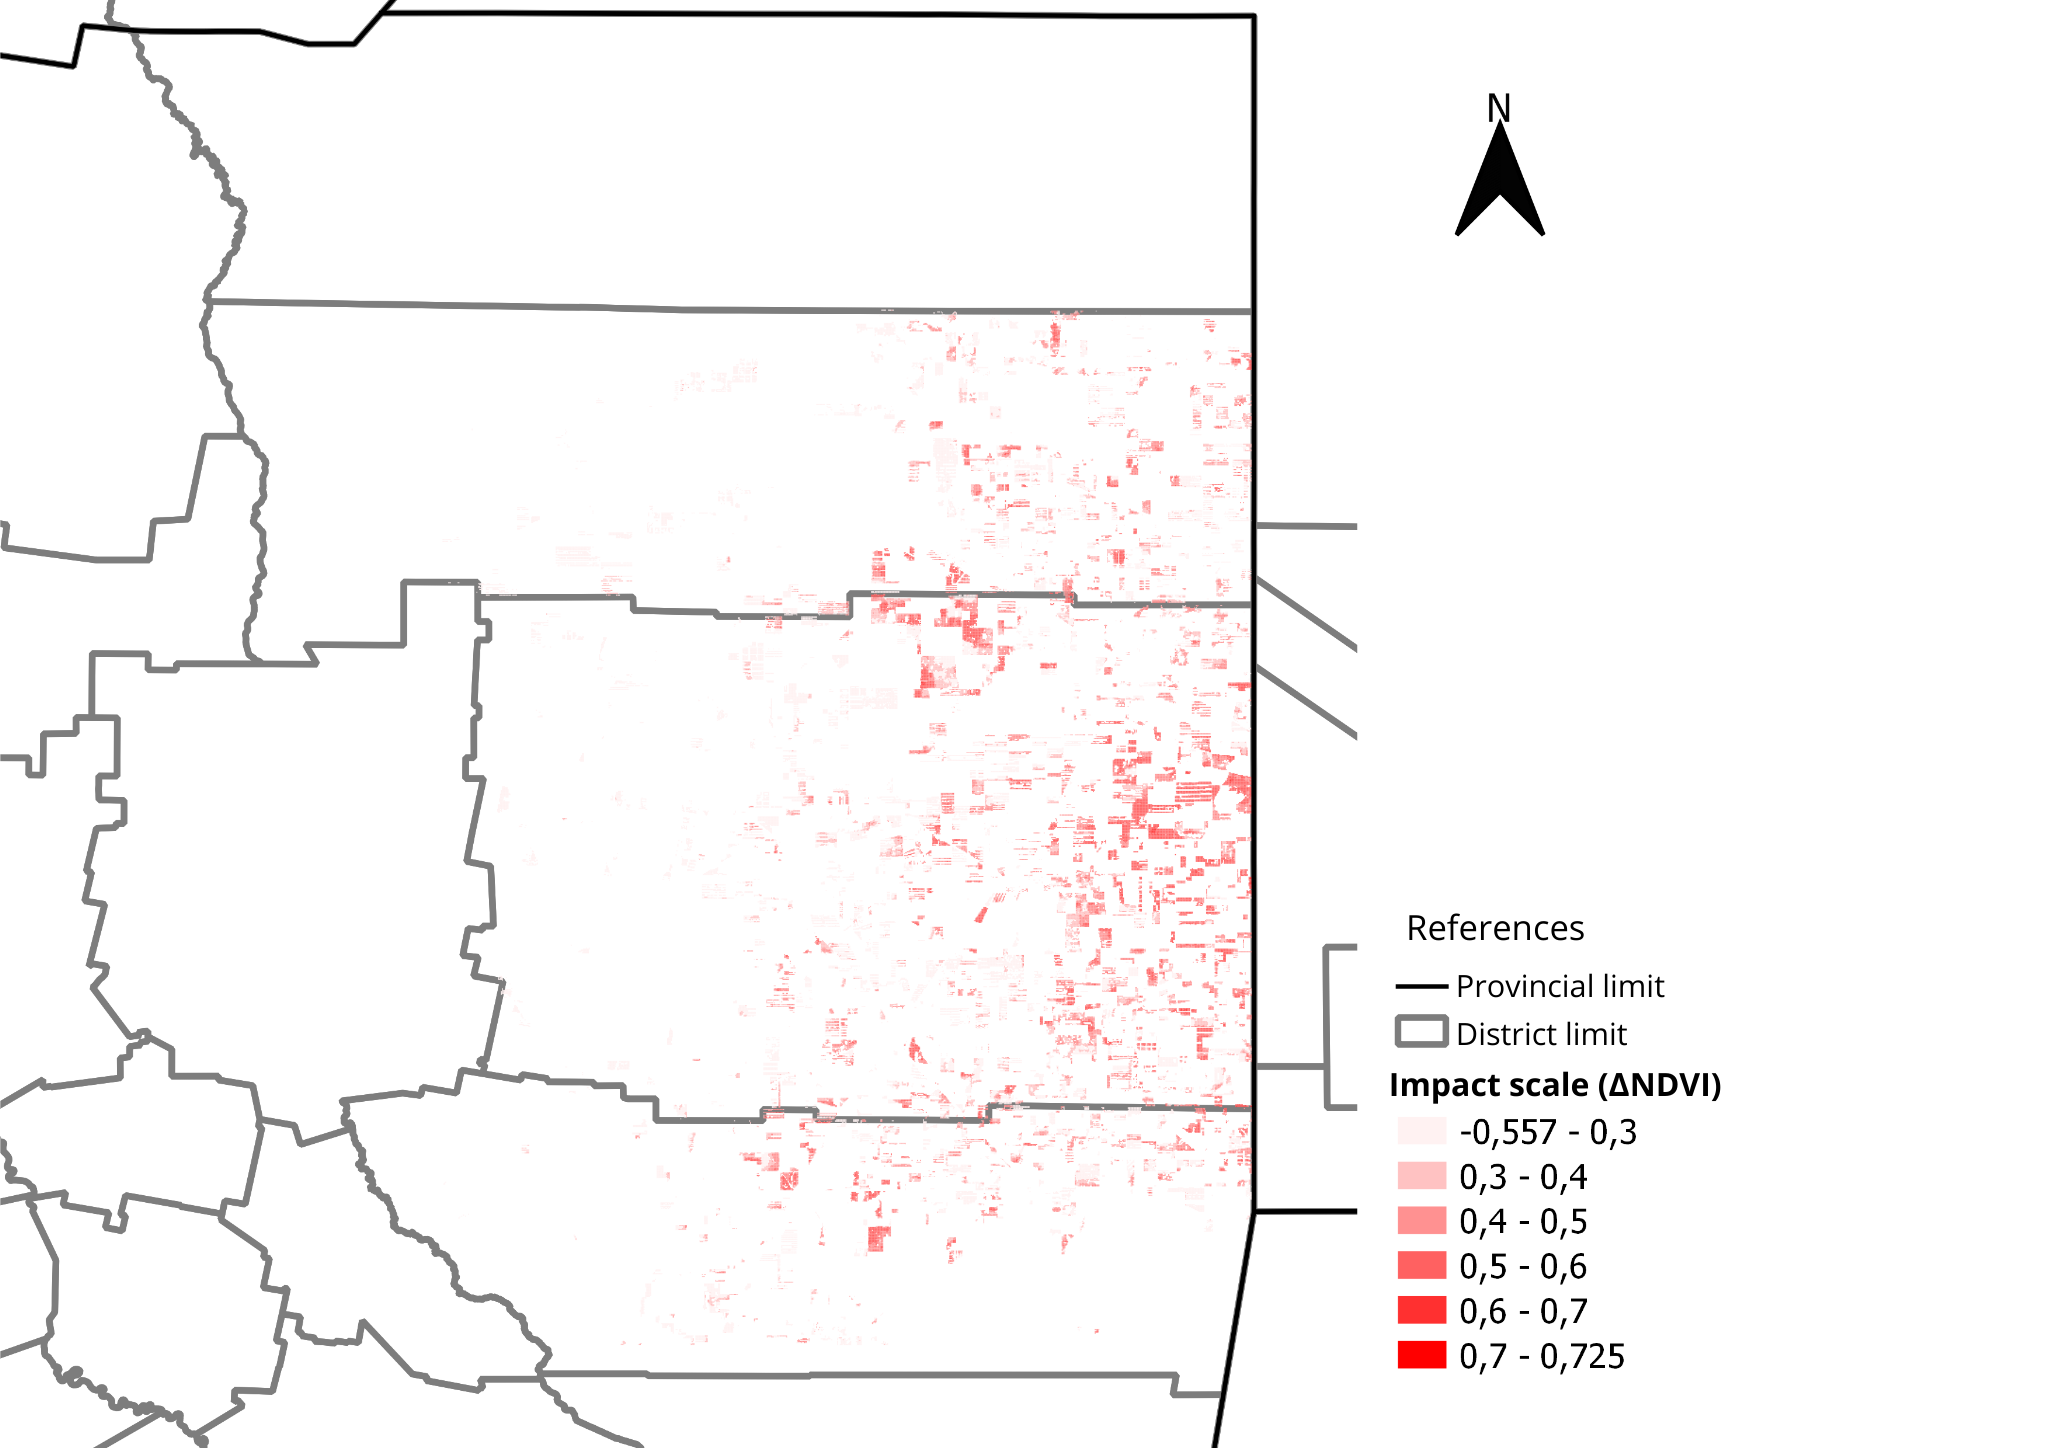
Additionally, a multitemporal NDVI raster was derived from the MOD13Q1 MODIS product (16-day composites, 250 m resolution). NDVI values were extracted for each grid cell across 11 time steps. The difference between March 5 and April 6 was computed, and polygons with declines ≥0.37 were identified (Fig. 3).
Results showed a statistically significant NDVI decline between March and April in fields reported with corn stunt symptoms compared with unaffected fields. Furthermore, the crop map for Alberdi, Moreno, and J. F. Ibarra indicated that 41.7% of maize polygons displayed evident damage consistent with corn stunt disease.
These findings support the use of vegetation indices from satellite imagery as effective tools to detect and quantify corn stunt damage. Remote sensing provides a scalable approach for integrating field observations with satellite data to monitor crop health, map disease incidence, and estimate potential yield impacts in extensive maize production systems.